
Optimizing Your Web App for Maximum Runtime Performance and Premature Optimization
...and talking about performance in general 🦄
💁🏼 TLDR: This blog talks about web performance, UX, and premature optimization. It briefs on when & where to consider optimizations in your software development cycle. It also gives you various ideas on how to fix said performance issues that I had to learn the hard way. It is a blog that I didn't have when I needed it, so I wrote it ✨
Websites nowadays fail to perform well on user inputs and actions. Poorly optimized frontend code can very easily break the user experience and the adoption rate.
- Your web application could have high user volumes, built to be delivered to the browser by a CDN for faster loading/caching, and designed with resilient architectures, well-performing backends, and disaster recovery mechanisms.
- Your web application could also load blazingly fast within 1s and could have the prettiest looking UI anyone has ever seen with lazy loading, code splitting, and all other load time optimizations.
Conversely, your application might have a poorly performing runtime frontend code, which breaks the entire experience for end-users in the long run. If your application is highly dynamic/real-time and relies mostly on user actions, there is a high chance that your application is client-side rendered(CSR) with technologies like React, Angular, or Vue. Hence, optimizing the front end becomes crucial to deliver a seamless user experience.
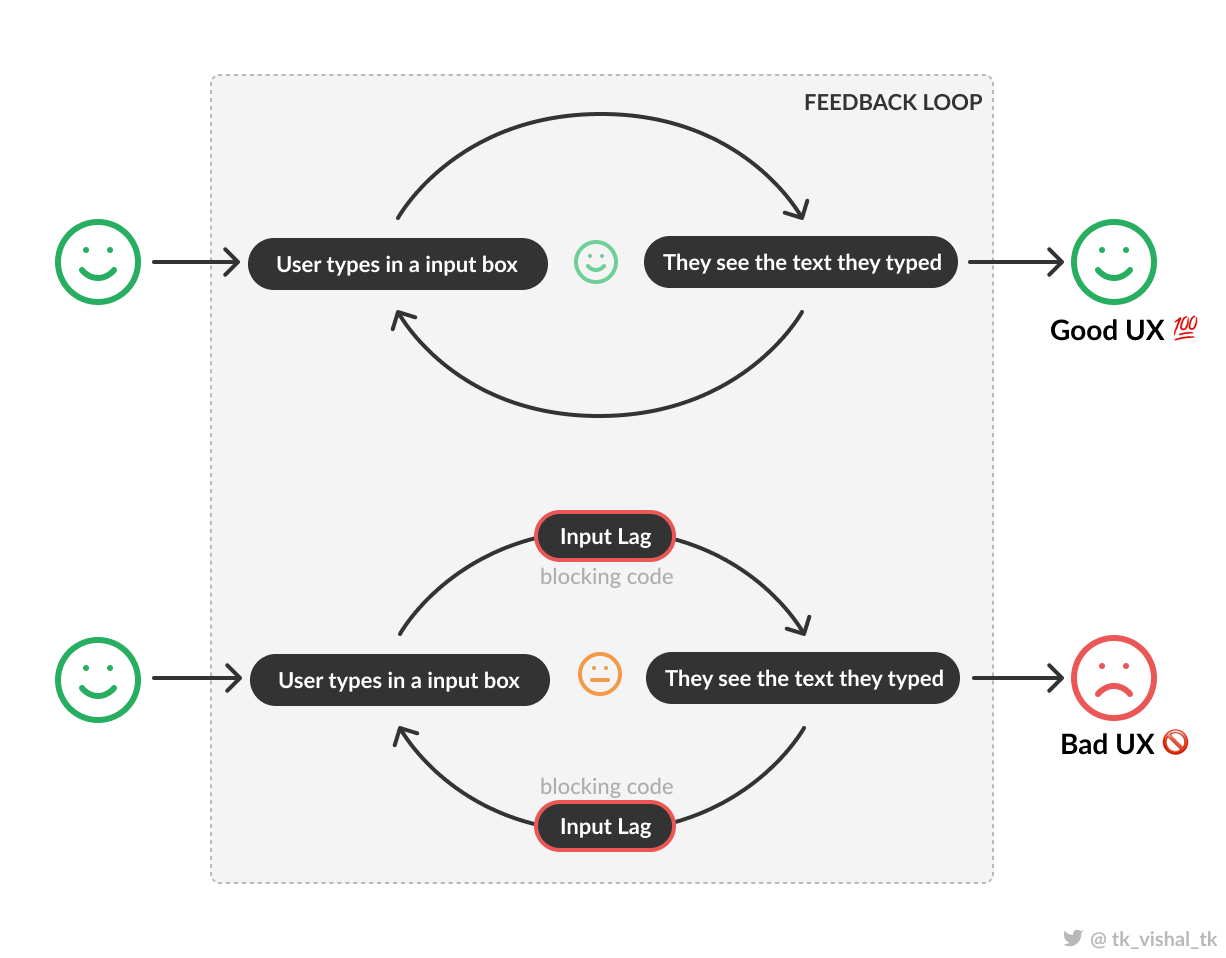
How performance affects user experience in a simple use case (How annoying is too annoying?)
A well-performing frontend should provide instant feedback for the action performed. Users expect a native feel to the web applications that they use in any form factor(desktop, mobile) as the line between native apps and standard web applications is becoming thinner day by day through Progressive Web Apps(PWA). Optimizing your app can have a drastic impact on your conversion rate and click-through rates.
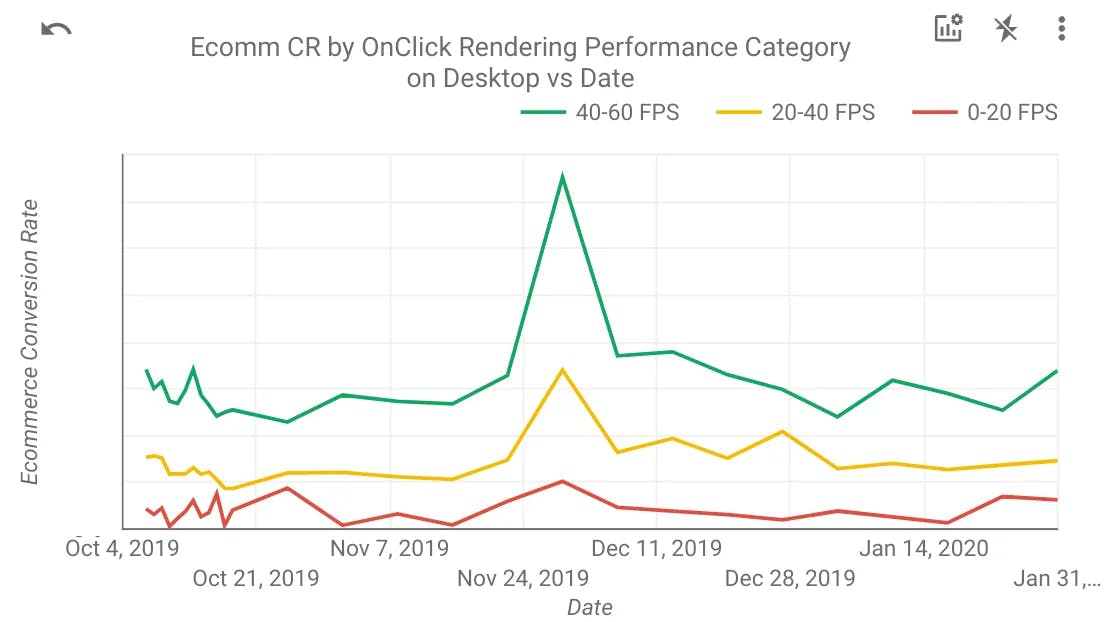
E-commerce conversion rate by On-Click Rendering Performance Category (desktop) from The Impact of Web Performance
Caring About Performance Too Early or Too Late 🐌
“move fast, break things” is a common motto around fast-moving projects. Although this is a good approach to ship “working“ products fast, It becomes very easy to forget about writing manageable performant code. Developers would be more focused on delivering the results first and caring about performance later. Depending on the application, the performance tech debt piles on and becomes unmanageable.
Hacky/patchy fixes would be made to critical parts of the application to fix the performance issues at the very end of the project. It can often lead to various unknown side effects on other parts of the project that no one in your team has ever seen before. Initially, developers write straightforward code that is easy to understand and takes less time to write. Thus, writing optimized code has a cost(time and resources) attached to it. Without proper documentation, the code base becomes complex with cryptic performance hacks.
We should forget about small efficiencies, say about 97% of the time: premature optimization is the root of all evil.
Yet we should not pass up our opportunities in that critical 3%.
- Donald Knuth
This does not mean that every line of code that you write should have a performance-saving gimmick.
- a proper performance fix is implemented only when it can be measured. Unmeasured performance fixes can very often lead to unexpected bugs and issues.
- caring about optimizing the non-critical part of your application is a huge waste of time and resources.
- fixing performance issues at the wrong time in your development cycle can also have a negative outcome.
While starting on a task or a project, some good premature optimization could be…
- Restructuring your files and folders, breaking your code into functions/components.
- Enforcing the usage of types on dynamically typed languages (optimizing workflow)
- The flow of data to and fro parent and child components.
and some bad premature optimization could be…
- Using profilers and fixing minor issues frequently without any feedback from your users.
- Using complex data structures and algorithms where a simple Array and inbuilt sort function would do the job.
When starting, it is necessary to think big. It should be less about “should I use a for or forEach loop?“ and more about “should I break down this huge component into sub-components to reduce unnecessary re-renders?“.
Measuring your frontend performance ⏲️
Runtime performance is a tricky problem to solve. The trickier part is measuring the performance and sniffing out the heavy components. Though there are various tools available to measure the frontend performance. It is always helpful to identify the main pain points of the application manually by clicking around. Identify components/pages taking most of the load and use it as a starting point. There can be various ways to measure performance depending on your app’s use case and complexity.
- Manually testing
- Stress testing with devtools CPU throttling
- Using Chrome Devtools
- Measuring performance on the code level
console.time(),console.timeEnd()performance.measure()react-addons-perf(more on react performance)
- Using a profiler
- React Devtools profiler
- Angular Devtools profiler
After an initial round of testing, you might get an idea of where and how to start optimizing your app. This blog assumes you have the prerequisite knowledge on how to read flame graphs and to get insights from the browser profiler.
Ways to Optimize 🤔
There are plenty of different ways to optimize your application depending on the tech stack that you use, frequency and shape of the data that you get from the server, use case of your application, and so on.
This write-up covers some of the methods in the increasing level of complexity. As the complexity increases, the performance fix becomes very narrow and context-specific to your application.
- Caching and Memoisation
- Layout Reflow & Thrashing
- Virtualization
- Delay and Debounce rendering
- Thinking outside the box
- Offloading to web workers
- Offloading to canvas
- Offloading to GPU/GPGPU (experimental)
Caching and Memoization 🗂️
By definition caching is a technique that stores a copy of a given resource and serves it back when requested. Memoization is a type of caching where expensive calculations are stored in a cache to avoid frequent recalculations. In a nutshell, your code memorizes the previously calculated results and serves when requested from the memory instead of bothering the CPU.

Choosing the right data type
This is where your good ol' data structures and algorithms knowledge plays a vital role. Consider a case where the server returns a list of users in an array of objects with a unique identifier userId. To perform lookup operations (which you might do frequently), it would take O(n) time where n is the number of users in the array. If you group the users by userId once and convert it to a key-value pair map. It can drastically reduce the lookup time to O(1). (more on the big-O notation)
You’ve basically indexed your local data for faster access. Trading some space in the heap memory for easier lookups instead of relying on the CPU for frequent operations.
// the array way 🚫
const usersArray = [{
    userId: 'ted',
    fullName: 'Ted Mosby',
    job: 'architect'
  },
  {
    userId: 'barney',
    fullName: 'Barney Stinson',
    job: 'unknown'
  },
  {
    userId: 'robin',
    fullName: 'Ribon Scherbatsky',
    job: 'news anchor'
  },
  ...
]

// straight forward way to lookup/search in O(n) worst case
const ted = usersArray.find(user => user.userId === 'ted')
Hashmaps/key-value pairs have constant time retrieval, lookups, searching, insertion and deletion. You can easily generate key-value maps from an array of objects by using lodash’s _.keyBy(usersArray, 'userId'). This makes it the perfect data structure if the data is constantly being used inside for loops and blocking code.
// the hashmap way ✅
const usersMap = {
  'ted': {
    userId: 'ted',
    fullName: 'Ted Mosby',
    job: 'architect'
  },
  'barney': {
    userId: 'barney',
    fullName: 'Barney Stinson',
    job: 'unknown'
  },
  'robin': {
    userId: 'robin',
    fullName: 'Ribon Scherbatsky',
    job: 'news anchor'
  },
  ...
}

// efficient way to lookup/search O(1) worst case
const ted = usersMap['ted']
Here, Array.indexOf() could be magnitude slower than object reference-based lookup and it looks a lot cleaner to read. That being said, the performance difference between both methods depends on your access patterns and the size of the array/object.
📝 What's the catch?
Using hashmaps should not always be your prime solution. Why so? because (JS is weird)
The way JS engine works is different on each browser, they have their own implementation of managing the heap memory. (V8 on Chrome, Spidermonkey on Firefox, and Nitro for Safari)
Object lookups could be sometimes faster on chrome and slower on firefox given the same data. It can also depend on the size and shape of the data inside your data structure (array/hashmap)
Always measure if the applied change has an impact on the final performance.
Function Level Memoization
Functional memorization is a frequently used technique in Dynamic Programming. It can memorize the function’s output and inputs so that when the caller calls the function again with the same inputs, it returns from its memory/cache instead of re-running the actual function.
A memorized function in JS consists of 3 major components…
- A higher-order function wrapper that wraps the expensive function in a closure.
- An expensive pure function that returns the same outputs for the same inputs under any conditions. Pure functions should not have any side effects nor should depend on any values outside their own scope.
- A
cachehashmap that acts as our memory and memorizes the input-outputs and key-value pairs.
difference between pure and impure functions
Here’s the memoize higher-order function implemented in typescript. It takes in a function and returns the memoized function. The expensive function(to be memorized) can have any number of arguments. The cache keys are transformed into primitive data types like string or number using the second argument in the higher-order function - transformKey. It is also fully typesafe! ✨
type AnyFn = (...args: any[]) => any

function memo<Fn extends AnyFn>(fn: Fn, transformKey: (...args: Parameters<Fn>) => string) {
  const cache: Record<string, ReturnType<Fn>> = {}

  return (...args: Parameters<Fn>): ReturnType<Fn> => {
    // transform arguments into a primitive key
    const key = transformKey(...args);
    // return from cache if cache hit
    if(key in cache) return cache[key];
    // recalulate if cache miss
    const result = fn(...args);
    // populate cache with result
    cache[key] = result;
    return result;
  }
}

const memoizedExpensiveFunction = memo(expensiveFunction, (...args) =>
  JSON.stringify(args)
);
Memoization is very well suited for recursive operations to cut whole chunks of redundant operations down the recursion tree. It is also helpful in functions where there are frequently repeated inputs giving out the same outputs. Instead of reinventing the wheel, you could use battle-tested memorize wrappers provided by libraries.
useMemo()in react_.memoize()in lodash@memoizedecorators
📝 What's the catch?
Memoization is not a solution to every expensive calculation problem, you should not opt into memoization when…
the expensive function depends on or affects some other value outside its own scope.
the input is highly fluctuating and irregular or where you don’t know the range of inputs. Since we are trading some space on heap memory for CPU cycles, erratic inputs can create a huge cache object and the use of memoization here would become useless.
Component Level Memoization and Preventing Unnecessary Rerenders
In the context of how React works, the component only rerenders with props or the state of a component has changed. When a parent component rerenders, all of its children rerender too. Rerendering is the process of calling the function/render method, Hence this is the perfect place to use our memoization techniques.
Before diving into memoizing our component, it is essential to optimize the component’s state first. A common mistake that most React devs make is misusing the useState hook to store constant mutating variables that do not reflect on the UI.
useState()is a better choice if the UI depends on the value else it is better to useuseRef()oruseMemo()for mutable variables instead.- when passing functions from the parent to child component, it is better to use wrap that function with
useCallback()instead of passing the functions themselves. Passing raw functions to memorized components would still trigger a rerender even when the props haven’t changed, since the parent component is rerendered, it created a new reference to the function and passed it to children, hence the rerender.
// passing raw functions ℹ️
export const ParentComponent = () => {
    const handleToggle = () => {
      // do something
    };
    return <SomeExpensiveComponent onToggle={handleToggle} />;
};

// using useCallback() to pass functions ✅
export const ParentComponent = () => {
    const handleToggle = useCallback(() => {
        // do something
    }, []);
    return <SomeExpensiveComponent onToggle={handleToggle} />;
};
After the preliminary steps, your component should have fewer rerenders now!
React decides to re-render the children whenever the parent component rerenders. If a child component is memorized, React first checks if the props have changed by doing a shallow comparison of props. If you have a complex object in your props, it only compares the object reference to the old and new props (a===b). The best part is that you have full control over this equality function to govern when to rerender the component based on old and new props.
const ExpensiveChildComponent = ({state}) => <div>{state}</div>

const MemoizedExpensiveChildComponent = React.memo(ExpensiveChildComponent, (oldProps, newProps) => {
  // do custom validation on old and new props, return boolean
})

export const ParentComponent = () => {
  const [someState, setSomeState] = useState({})

  return <MemoizedExpensiveChildComponent state = {someState} />
}
📝 What’s the catch?
If your component depends on
useContext(),React.memo()is useless. The component would rerender irrespective if the memo.use useCallback() only when the preformance benifit is quanifiable, useCallback() can become a source of performance issue if not used at the right place
use useMemo() in the component only when the component re-renders often with the same props.
Sometimes custom comparing the props can consume more CPU cycles than actually rerendering the component, so measure first then apply the performance fix.
Layout Reflow & Thrashing 🌊
Layout reflow is when the browser calculates the dimensions, position, and depth of an element in a webpage. A reflow would occur when...
- getting/setting measurements of elements' metrics using
offsetHeight,scrollWidth,getComputedStyle,and other DOM functions. - adding/inserting or removing an element in the DOM tree.
- changing CSS styles.
- resizing browser window or iframe window.
- basically, any operation that would need the browser to modify the presented UI on the screen.
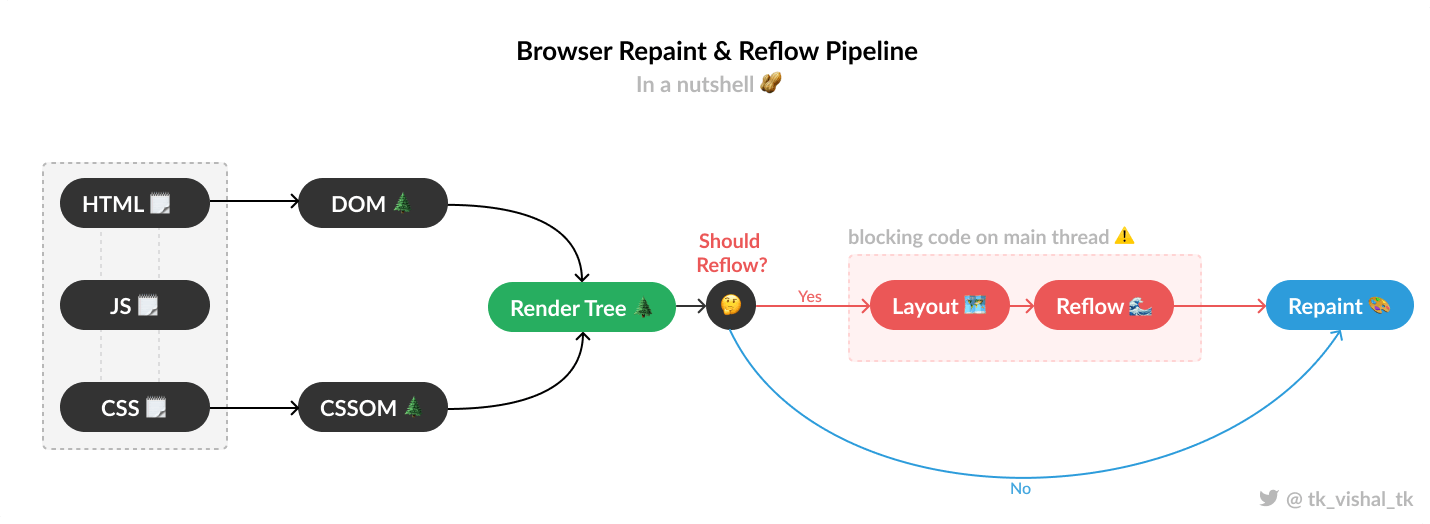
very high-level overview of the browser rendering pipeline
When a reflow happens, the browser would synchronously(blocking code) recalculate the dimensions and positions of elements on the screen. As you might have guessed, reflowing is a very expensive job for the render pipeline, so the browser tries to queue and batch the updates so that it can reflow the whole UI at once instead of blocking the main thread with frequent reflows.
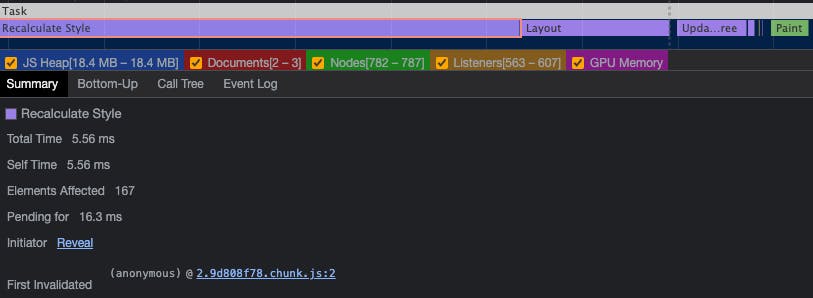
The recalculate style in the performance chart means that the browser is reflowing
The performance impact due to reflowing depends on the complexity of the reflow. A call to getBoundingClientRect() on a smaller DOM tree would have a lesser impact on performance than calling the same on a larger nested DOM tree. Reflow in itself is an essential part of the rendering process and it is acceptable on lower margins.
Consider the following piece of code,
for (let i = 0; i < listItems.length; i++) {
    listItems[i].style.height = listContainer.clientHeight + 15 + "px"
}
Here, the width and offsetHeight are being read or written inside a for-loop for all the items inside a list. Assume there are 500 list items and is getting called every time there is a new list item. There is an obvious performance hit when these properties are called too frequently, the browser keeps adding those calls to the queue to process them later. At one point when the browser flushes the queue, the browser struggles to optimize and batch the reflows, but it cannot since the code is requesting clientHeight in quick successions inside a for-loop, which triggers layout → reflow → repaint synchronously on every iteration.
 When this happens, the page freezes for some seconds and this is called Layout Thrashing. This is a minor hiccup on desktops and laptops but has severe browser-crashing consequences on lower-end mobiles.
This is a very common mistake that many developers make, lucky for us the solution is very simple and right before your eyes.
Caching outside the loop
We cache the reflow-triggering value outside any kind of loop. So, we just calculate the height/width only one time allowing the browser to optimize it on its own.
const listContainerHeight = listContainer.clientHeight
for (let i = 0; i < listItems.length; i++) {
    listItems[i].style.height = listContainerHeight + 15 + "px"
}
Read & Write Pattern
We learned that browser tries to batch and optimize subsequent reflow layout calls into one single reflow. We can use this to our advantage. The code example illustrates better…
/// "read - write - read - write - read - write" pattern ❌
// read
let listItem1Height = listItem1.clientHeight;

// write (triggers layout)
listItem1Height.style.height = listItem1Height + 15 + "px";

// read (reflows layout)
let listItem2Height = listItem2.clientHeight;

// write (triggers layout)
listItem2Height.style.height = listItem2Height + 15 + "px";

// read (reflows layout)
let listItem3Height = listItem3.clientHeight;

// write (triggers layout)
listItem3Height.style.height = listItem3Height + 15 + "px";


/// "read - read - read - write - write - write" pattern ✅
// read (browser optimizes)
let listItem1Height = listItem1.clientHeight;
let listItem2Height = listItem2.clientHeight;
let listItem2Height = listItem2.clientHeight;

// write (triggers layout)
listItem1Height.style.height = listItem1Height + 15 + "px";
listItem2Height.style.height = listItem2Height + 15 + "px";
listItem3Height.style.height = listItem3Height + 15 + "px";

// reflow just one time and its seamless
Using window.requestAnimationFrame()
window.requestAnimationFrame() or rAF is used to tell the browser that you are going to perform animations, Hence it calls the callback inside rAF before the next repaint. This allows us to batch all the DOM writes(reflow triggering code) inside rAF guaranteeing that browser runs everything on the next frame.
// read
let listItem1Height = listItem1.clientHeight;

// write
requestAnimationFrame(() => {
  listItem1Height.style.height = listItem1Height + 15 + "px";
})

// read
let listItem2Height = listItem2.clientHeight;

// write
requestAnimationFrame(() => {
  listItem2Height.style.height = listItem2Height + 15 + "px";
})

// read
let listItem3Height = listItem3.clientHeight;

// write
requestAnimationFrame(() => {
  listItem3Height.style.height = listItem3eight + 15 + "px";
})

// browser calls rAF on the next frame hence reflows smoothly
Virtualization 👁️
Games tend to have highly detailed 3D models, huge textures, huge open-world maps, and complex shaders that fill in an immersive environment around the player. How do they optimize all those complex models into a limited compute GPU and still get 60+ FPS?

The blue cone is the view frustum of the player and it only renders the resource inside it, shown behind the scenes in Horizon Zero Dawn(more about it)
They use a technique called Frustum Culling. Frustum culling is the process of removing objects that lie completely outside the viewing frustum(POV) of the player. It removes everything that’s outside the player’s POV and spends all the computing power to render only the resources that the player is looking at. This technique was invented many years ago and it is still one of the major(default) ways to boost the runtime performance in games.
We can use this same old technique on our apps too! The web folks call it Virtualization. Imagine a large list or an infinite(pannable, zoomable) canvas or a huge(horizontally and vertically scrollable) grid of items. Optimizing the runtime on these kinds of use-cases could be a hard problem to tackle.

virtualizing a
<ul>list, items highlighted blue are rendered, grey is not rendered, and outside user's view (via Brian Vaughn)
Lucky for us, there is a react library (react-window) that handles the virtualization logic for you. Virtualization works by implementing 3 core ideas…
- Having a viewport container DOM element that acts as your scroll container.
- Having a smaller element that contains your viewable items of a list.
- Absolutely positioning the list items based on current scroll position, width, and height of scroll container.
Since the browser spends all of its compute power on rendering what the user is currently seeing, you would gain a huge performance boost very easily.
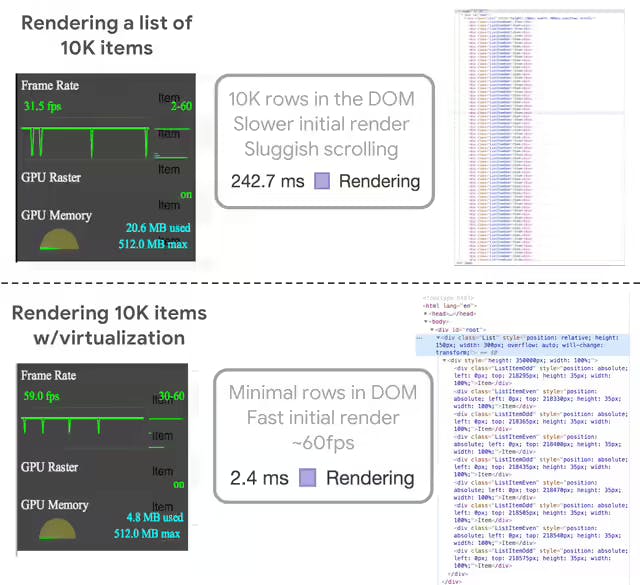
performance upgrade with and w/o virtualization (via List Virtualization)
react-window provides easy-to-use components that make implementing virtualization into your apps a piece of cake. react-window wraps your list item in a parent component that would handle all the virtualization logic under the hood. react-window expects a fixed height for the parent scroll container and precalculated height for the list item.
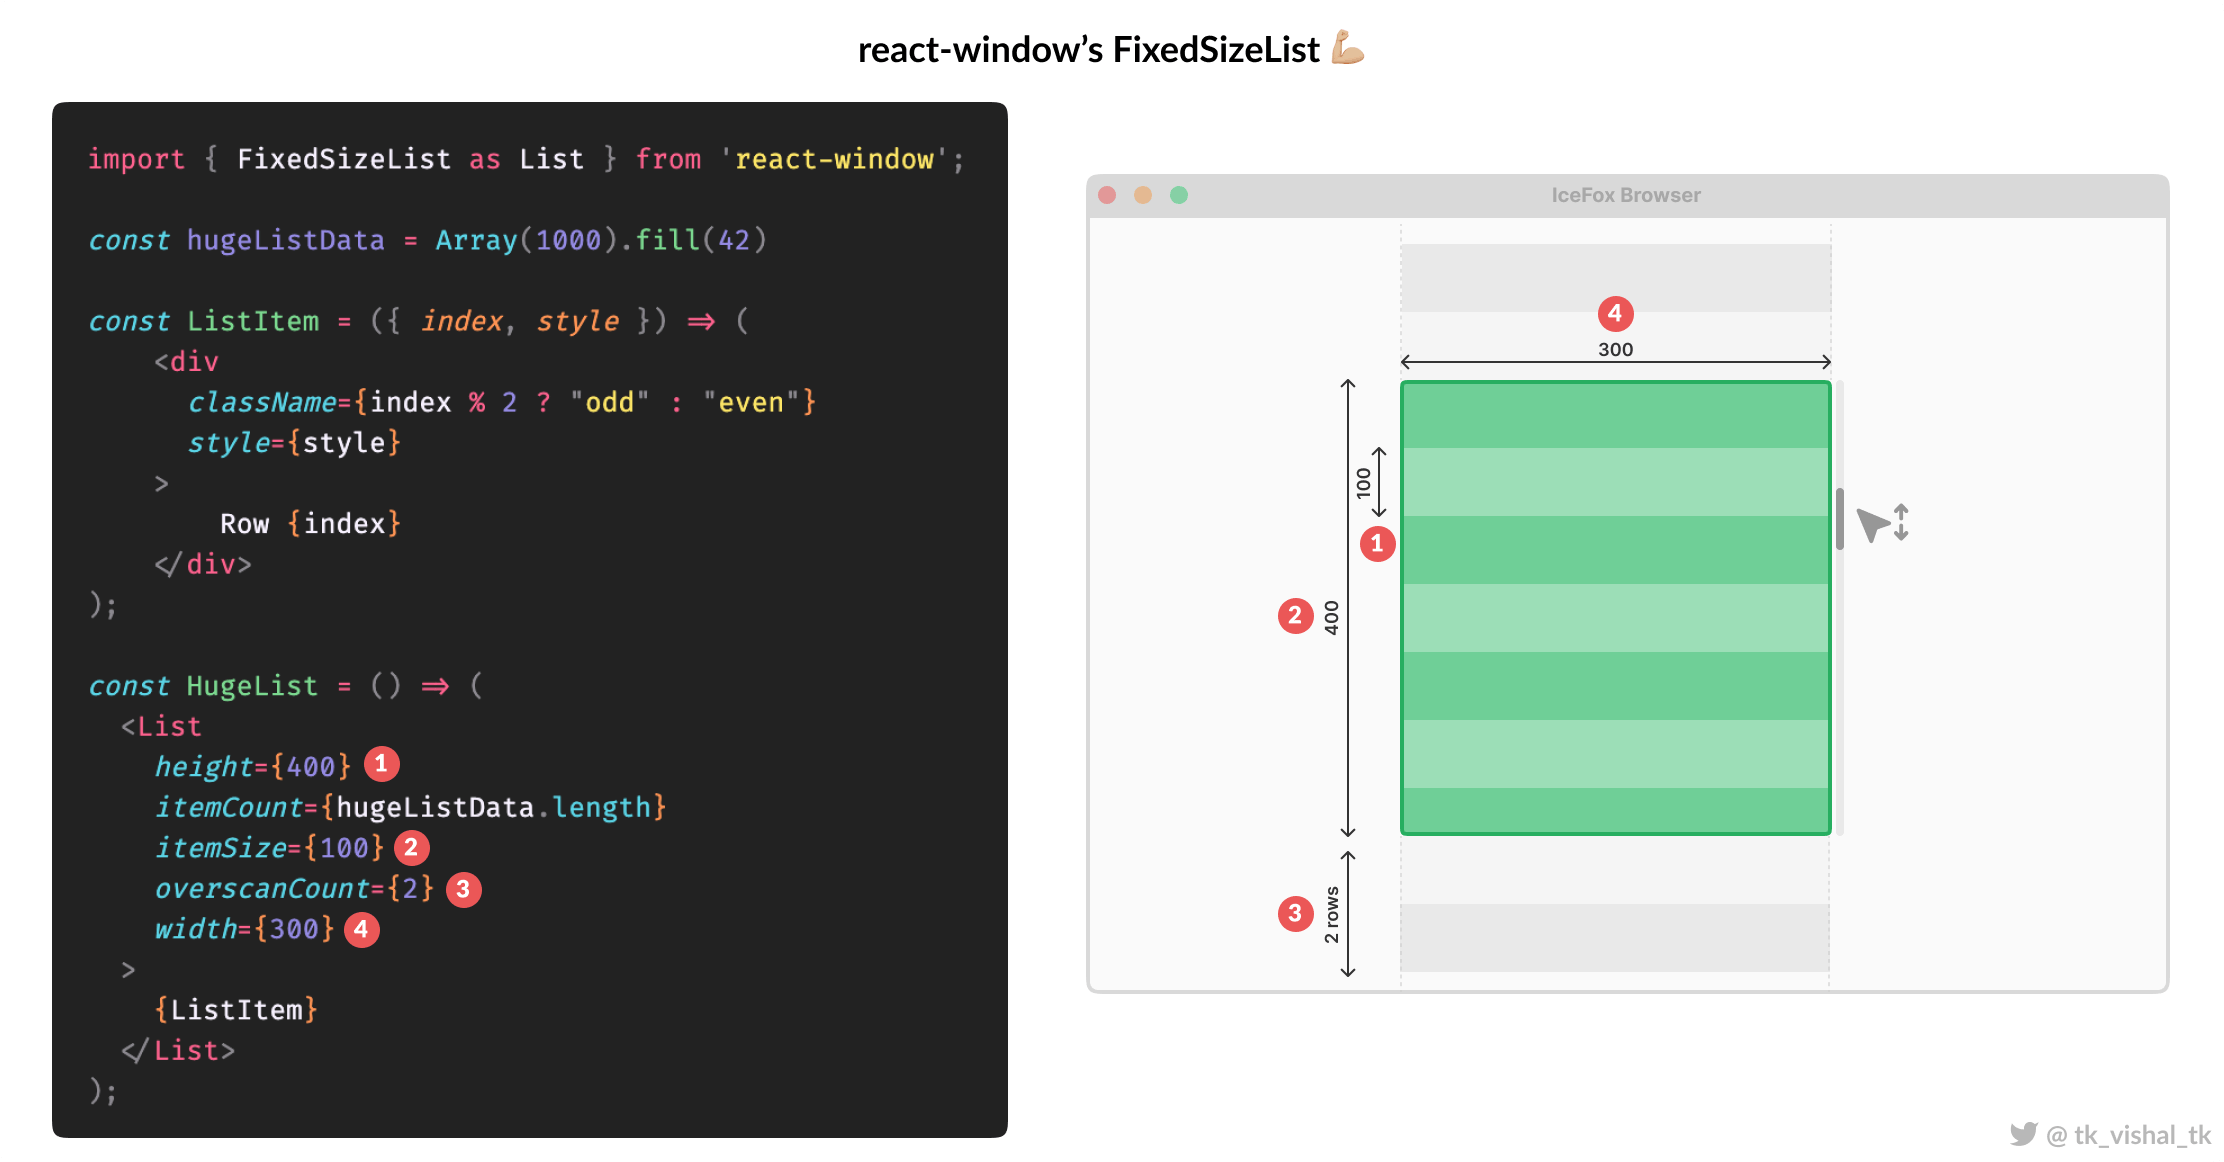
Illustrating react-window
FixedSizeListAPI
If the height of all the list items is known and calculated, you can use the FixedSizeList. If the height of each list item depends on the content of the item, then you can precalculate heights with a function and pass it to a VariableSizeList in the itemSize prop. You can also use the overscanCount to render a specific number of items outside the scroll area if your list items need to prefetch image assets or to catch the focus of the user.
const rowHeights = new Array(1000)
  .fill(true)
  .map(() => 25 + Math.round(Math.random() * 50));

const getItemSize = index => rowHeights[index];

const ListItem = ({ index, style }) => (
  <div style={style}>Row {index}</div>
);

const HugeList = () => (
  <VariableSizeList
    height={150}
    itemCount={1000}
    itemSize={getItemSize}
    width={300}
  >
    {ListItem}
  </VariableSizeList>
);
react-window also supports grid-based UI where there’s both horizontal and vertical scrolling(think of large e-commerce websites or an excel sheet) with variable item heights or widths. react-window-infinite-loader package that supports infinite loading and lazy load content outside the scroll area and also provides virtualization capabilities.
const HugeGrid = () => (
  <VariableSizeGrid
    columnCount={1000}
    columnWidth={getColumnWidth} // takes in current index
    height={150}
    rowCount={1000}
    rowHeight={getRowHeight} // takes in current index
    width={300}
  >
    {GridItem}
  </VariableSizeGrid>
);
📝 What’s the catch?
It goes without saying that, do not use virtualization for lists with less number of items, measure first, then go for virtualization. Since there is a CPU overhead in running the virtualization algorithm.
If the list item has highly dynamic content and constantly resizing based on the content, virtualization could be a pain to implement.
If the list items are added dynamically with sorts, filters, and other operations,
react-windowmight produce odd bugs and blank list items.
Delay and Debounce Rendering ⛹🏼
Delaying and Debouncing rendering is a common practice to reduce unnecessary re-renders on frequent data changes. Some modern web apps process and render tons of complex data arriving at extreme speeds through WebSockets or HTTP long polling. Imagine an analytics platform catering real-time analytics to users through the data arriving at the frontend using WebSockets at the rate of 15 messages per second. Libraries like react, and angular is not built for rerendering a complex DOM tree at that rate and humans can’t perceive data changes at rapid intervals.
Debouncing is a common practice used in search inputs where each onChange() event triggers an API call. Debouncing prevents sending an API request for each letter change, instead, it waits for the user to finish typing for a specified amount of time and then sends an API request. We can use this technique for rendering too!
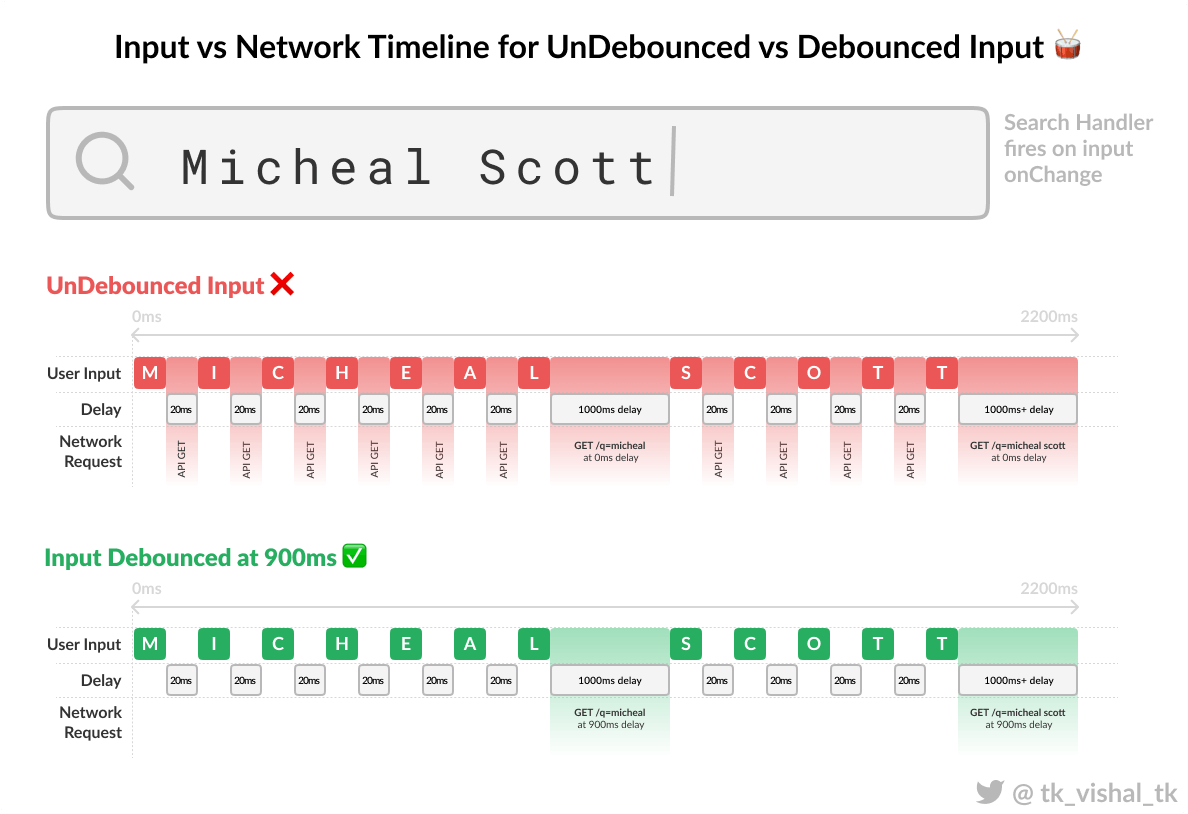
Illustration of how debouncing can optimize unnecessary API requests
I won’t go too deep into how to implement debouncing on API requests. We’ll concentrate on how we could debounce renders using the same method. Imagine you have a stream/burst of messages coming through a single WebSocket channel. You would like to visualize said messages in a line graph. There are 3 main steps to debounce the renders…
- A local buffer that would hold your WebSocket/frequently changing data outside of React/angular context (
useRef()) - A WebSocket listener that takes in the messages from the network, parses, transforms them into an appropriate format, and puts them in the local buffer.
- A debounce function that when triggered would flush the buffer data to the component’s state to trigger a rerender.
const FrequentlyReRenderingGraphComponent = () => {
    const [dataPoints, setDataPoints] = useState<TransformedData[]>([]);
    const dataPointsBuffer = useRef<TransformedData>([]);

    const debouceDataPointsUpdate = useCallback(
        debounce(() => {
            // use the buffer
            // update the latest state with buffer data however you want!
            setDataPoints((dataPoints) => dataPoints.concat(dataPointsBuffer.current));

            // flush the buffer
            dataPointsBuffer.current.length = 0;
        }, 900),
        // sets the state only when websocket messages becomes silent for 900ms
        []
    );

    useWebsocket(ENDPOINT, {
        onmessage: (data) => {
            const transformedData: TransformedData = transformAndParseData(data);
            // push into buffer, does not rerender
            dataPointsBuffer.current.push(transformedData);
            // important part of debouncing!!!
            debouceDataPointsUpdate();
        },
    });

    return <LineGraph dataPoints={dataPoints} />;
};
Here’s a high-level implementation of debouncing the render. You can change the useRef() buffer setter in the WebSocket message event and flushing logic during debounce however you want that is efficient depending on the shape of data.
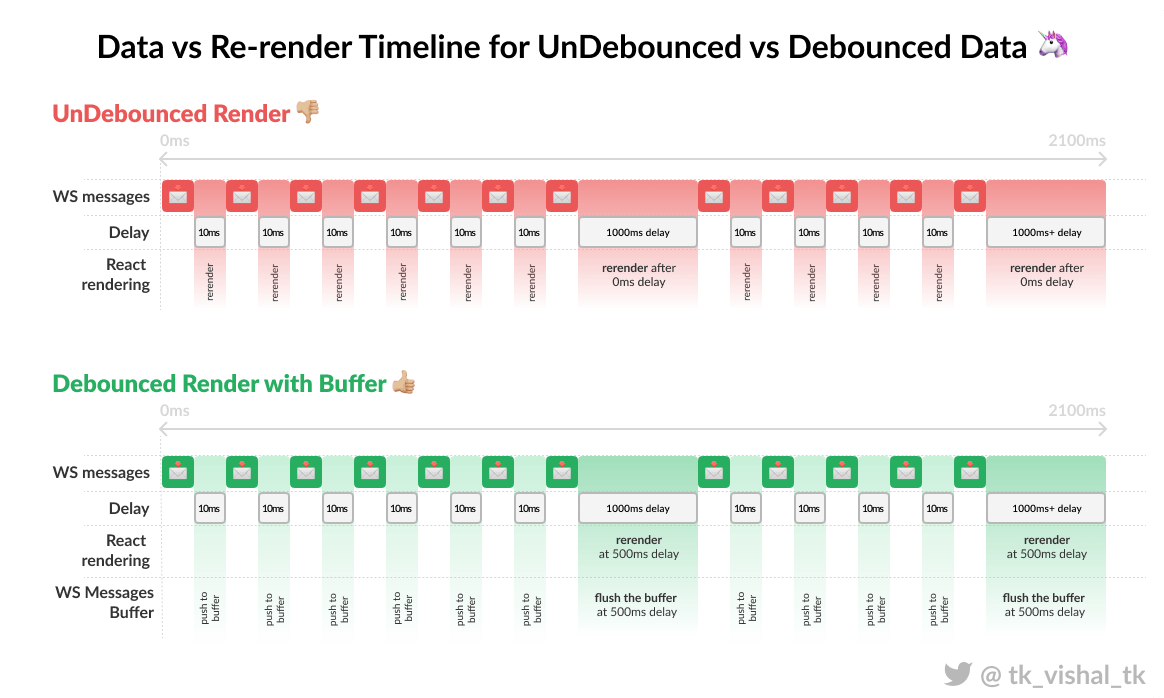
Illustration of how debouncing can optimize unnecessary re-renders
There are many libraries that provide debounce functions out of the box…
- RxJS
debounce()function. - lodash
_.debounce()function. - custom react hook
useDebounce()
📝 What’s the catch?
Debouncing should only be used on components that are frequently re-rendering or does any expensive job frequently.
Buffering on real-time data can introduce race-condition bugs if not done carefully since you are maintaining two sources of truth at any point in time (buffer data and actual data)
Debounce only when you surely know there is a breathing time to flush the buffer and set the state, else the component won’t rerender, and the buffer would indefinitely grow in size!
Thinking Out of the Box 🧠
Sometimes, any kind of optimization that you do internally in your codebase wouldn’t be enough. That’s when fixing a performance issue is not just a bottleneck to the UX, it becomes a bottleneck to the solution your web app is providing. Hence, we must find clever ways to think outside of the existing ecosystem in search of making our web app “usable”.
Do you think apps like Figma and Google Docs are just made up of DOM elements? These apps exit out of the native approach to provide better solutions to users. At this point, it is not about fixing a performance Bug, it is more about adding an innovative Feature to your web app.
Offloading to Web Workers 🧵
Javascript is famously known to be single-threaded. Since it is single-threaded, we don't have to think about complex scenarios like deadlocks. Since it is single-threaded, It can only run one task at a time(synchronous). To queue all these tasks for the CPU to execute, it uses a mechanism called an event loop.
The OS and your browser have access to any number of threads your CPU provides. That’s why the browser can handle multiple tabs at once parallelly. What if we could somehow get access to another thread to do some of our complex operations?
That’s exactly why Web Workers are made.
Imagine you have a huge React app with a fairly complex DOM tree that updates frequently on network changes. You are asked to perform a huge image processing/mathematical operation with huge images or inputs. Usually, when done in a normal way would fill in the main thread pool blocking other essential operations like event listeners, rendering, and painting of the whole page. Hence, we use a Web Worker process to offload the work to a separate thread and get back with results(asynchronous).
//// main.js
const worker = new Worker('worker.js');
// send complex operation inputs to worker.js
worker.postMessage(data);
// receive data from a worker.js
worker.onmessage = (event) => {
  console.log(event.data);
}

//// worker.js
// receive data from main.js
self.onmessage = (event) => {
  // do complex operation here
  // send results to main.js
  self.postMessage(data);
}
The worker API is very simple, you would post a message to the worker. The worker would have the code to process and reply back with the results to the listeners. To make it even easier Google has created the comlink library.
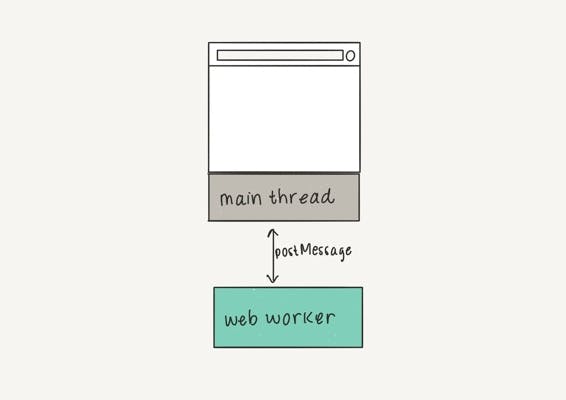
illustration of web workers(via Web workers vs Service workers vs Worklets)
It is important to note that the web workers operate under a separate context, so your global/local variables applied on your main codebase won’t be available in the worker.js file. So, you would need to use specific bundling techniques to preserve the context between workers and main files. If you would like to integrate web workers with React’s useReducer() hook, the use-workerized-reducer package provides a simple way to do so. Thus, you can also process heavy state processing and also control react’s component lifecycle based on web worker’s results.
const WorkerComponent = () => {
    const [state, dispatch, busy] = useWorkerizedReducer(
        worker,
        "todos", // reducer name in worker.js
        { todos: [] } // reducer intial state
    );

    const addTodo = (todo) => {
      dispatch({ type: "add_todo", payload: todo })}
    }

    return <div>{busy ? <Loading /> : <TodoList todos={state.todos} />}</div>;
};
📝 What’s the catch?
- Web workers have a separate context from your main application, so it is necessary to bundle your code with webpack loader like
worker-loader(more info)- You cannot use web workers to manipulate DOM or add styles to the page.
Offloading to Canvas 🎨
This is essentially a hacky way to render the UI, In some cases, the WebSocket messages would be coming at rapid speeds with no breathing time. In such cases, debouncing won’t solve the problem. These use-cases can be seen on trading and crypto platforms where there is a high volume of changes. CoinBase solves the problem elegantly by using a canvas in the middle of a reactive DOM UI. It performs very well under rapid data changes and looks seamless with the native UI.
 Here’s how the UI updates compared to the WebSocket messages in the network tab…

The speed at which the data updates in the CoinBase web app
The whole table is just a canvas, but note that I can still hover over each row and get a hover highlight effect. This is by simply overlaying a DOM element on top of the canvas, but the canvas handles all the heavy lifting of rendering the text and alignment.
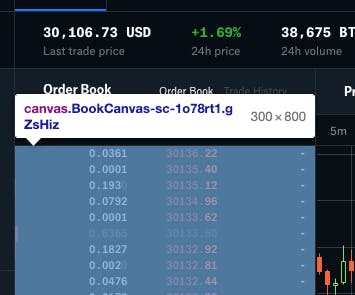
It's just a long canvas underneath!
Offloading the work to canvas is very common when working with highly dynamic data like rich text editing, infinite dynamic grid content, and rapidly updating data. Google has adopted canvas as their main rendering pipeline in Google Docs and Sheets to have more control over primitive APIs and most importantly to have greater control over performance.
📝 What’s the catch?
- It is a hacky procedure to use a canvas inside a reactive DOM tree, there will be lots of “reinventing the wheel“ situations for basic functionalities like text alignment and fonts.
- Native DOM accessibility is lost in canvas-based data/text rendering.
Offloading to GPU/GPGPU (Experimental) 🔬
This is where the write-up gets experimental and there’s very less chance that you’d use this technique on a real project. Imagine you’d have to train a neural network or batch process hundreds of images parallel or perform complex mathematical operations with a stream of numbers. You might fall back to using a web worker thread to do the job(which would still work). But the CPU only has limited threads and a very limited number of cores. This means that it can process data faster with low latency but it cannot handle fast parallel operations very well.

That’s why GPUs are made! Games and video encoding/decoding requires parallel processing on individual pixels on the screen for faster rendering at 60+FPS. GPUs have thousands of cores and are specially made to handle heavy parallel processing tasks. Using a CPU for these kinds of tasks would work but it would be too slow and would severely hog the CPU blocking other OS jobs.
The tradeoff is that interfacing the GPU(GLSL Shaders) with the JS environment is the hardest part. GPUs are made to handle textures/images in a particular data structure. Doing trivial calculations with GPU requires hacky techniques to upload and download data from GPU. The GPUs performing these kinds of non-specialized CPU-related calculations are called GPGPU(General Purpose GPU).

The NVIDIA GEFORCE RTX 3090 GPU 🏇🏼
// generates input matrices
const generateMatrices = () => {
    const matrices = [[], []];
    for (let y = 0; y < 512; y++) {
        matrices[0].push([]);
        matrices[1].push([]);
        for (let x = 0; x < 512; x++) {
            matrices[0][y].push(Math.random());
            matrices[1][y].push(Math.random());
        }
    }
    return matrices;
};

// create a kernel(function on GPU)
const gpu = new GPU();
const multiplyMatrix = gpu
    .createKernel(function (a, b) {
        let sum = 0;
        for (let i = 0; i < 512; i++) {
            sum += a[this.thread.y][i] * b[i][this.thread.x];
        }
        return sum;
    })
    .setOutput([512, 512]);

// call the kernel
const matrices = generateMatrices();
const result = multiplyMatrix(matrices[0], matrices[1]);
Here are the real-world test results from GPU.js, notice that you don’t see any difference in computing time until the 512x512 matrix operation. After that point, the compute time for CPUs increases exponentially!
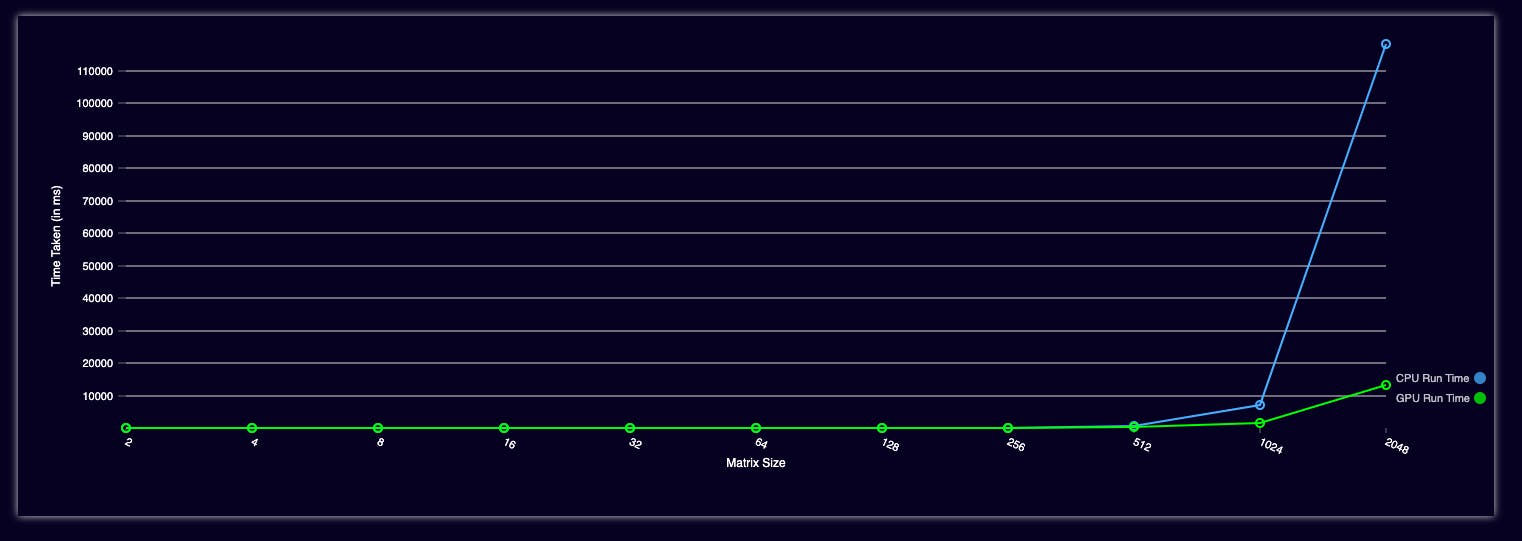
Comparing CPU vs CPU performance on matrix multiplication (via GPU.js)
📝 What’s the catch?
- GPU-based general computation should be done with care, GPUs have configurable floating-point precisions and low-level arithmetics.
- Do not use GPGPU as a fallback for every single heavy calculation, as shown in the graph about it provides a boost in performance only if the calculations are highly paralleled.
- GPUs are best suited for image-based processing and rendering.
~ That is it, at least for now, ~
Why did I write this very long blog?
Without doubt! This is the longest blog I’ve ever written. It is a culmination of raw experience and learnings from my previous projects. It's been on my mind bugging me for a very long time. We developers tend to work fast on features, push working code and call it a day. This looks good from a deliverable and management perspective. But, it is absolutely necessary to think about the end-users situation while you are working on a feature. Think about the type of device they would be using, and how frequently the user would be interacting. I’ve learned most of the web development on a 2GB RAM laptop with a Pentium processor, so I know the pain T_T.
 There is no right way to measure the performance, attach a deadline to the performance fix or quantify everything beforehand. It is a continuous process that requires reconnaissance skills.
Although it is very hard to include/quantify a performance budget on every feature in a fast-moving project. Think how a particular feature addition would affect your application in the long run and document it. It is the individual developer’s responsibility to think big and try to write performant code from the ground up.
~ ciao 🌻 ~

if you want to get in touch for a chat, you can follow me on Twitter @tk_vishal_tk
